7 Metrics Every AI Startup Must Track to Avoid Burning Cash
Cost per inference. Gross margin per inference. Model downgrade tolerance. Most AI startups track SaaS metrics and miss the real numbers. Here are 7 that will save you from burning cash – with benchmarks and implementation steps.

Your AI startup is not a software company. Stop tracking software metrics. You are burning cash and you don't even know where.
Let me tell you something that is happening right now, all around you.
AI startups are raising money. They are hiring PhDs. They are renting GPU clusters. They are burning $500,000 per month on OpenAI API calls and AWS p4d instances.
And they have no idea if any of it is working.
I have seen the pitch decks. "We have 10,000 users!" Great. How many are paying? "We will figure that out later."
I have seen the dashboards. MRR. Churn. LTV. The same SaaS metrics that worked for a CRM company in 2018. Applied to an AI company in 2026. It is like measuring a rocket ship with a tape measure.
AI startups are different. Your costs are not fixed. Your marginal cost per user is not zero. Every API call, every token generated, every GPU hour costs real money. If you track SaaS metrics, you will see revenue growing and assume you are healthy. You will be wrong. You will be bleeding cash through a hole you did not know existed.
This article is about the seven metrics that actually matter for an AI startup. Not the vanity metrics VCs want to see. The operational metrics that tell you if you are building a business or a very expensive science project.
Because the AI winter is coming. It always does. And the startups that survive will be the ones who tracked the right numbers.
What Makes an AI Metric Different from a SaaS Metric?
Traditional SaaS has a beautiful property: low marginal cost.
| SaaS cost structure | AI cost structure |
|---|---|
| High fixed cost (development) | High fixed cost (model training, infrastructure) |
| Low marginal cost (hosting a user costs pennies) | High marginal cost (every API call, every token, every GPU hour) |
| Gross margins: 70-85% | Gross margins: 30-60% (if you are lucky) |
If you track SaaS metrics for an AI startup, you will miss the single most important thing: unit economics per inference.
An AI metric is worth tracking if it answers one of these questions:
| Question | Why It Matters |
|---|---|
| What does it cost to serve one customer? | Your margin depends on this |
| Will that cost decrease over time? | Or will it increase with usage? |
| Are we spending more on LLMs than we make from customers? | The existential question |
| Is our model improving faster than our costs are growing? | The only sustainable advantage |
Here are the seven metrics that answer these questions.
Metric #1: Cost Per Inference (CPI) – The Most Important Number You Are Not Tracking
What it is:
The total cost of generating one unit of output from your AI model. One API call. One generated image. One chat completion. One analysis.
How to calculate it:
CPI = (Total AI infrastructure cost in period) ÷ (Number of inferences in period)
Break down the numerator:
| Cost component | Example |
|---|---|
| LLM API costs | OpenAI, Anthropic, Google, Cohere |
| GPU compute (if self-hosted) | AWS p4d, p5 instances, Lambda Labs, RunPod |
| Vector database | Pinecone, Weaviate, pgvector |
| Embedding costs | Generating embeddings for RAG |
| Prompt caching | If you use prompt caching APIs |
| Fine-tuning costs | Spread over expected usage |
Why it matters:
This number tells you if your business model is mathematically possible.
Example:
| Metric | Value |
|---|---|
| Cost per inference | $0.05 |
| Inferences per customer per month | 1,000 |
| Cost per customer per month | $50 |
| Revenue per customer per month | $49 |
You are losing $1 per customer per month. Scale makes it worse.
What is a healthy CPI?
| Business model | Target CPI | Why |
|---|---|---|
| Free tier / acquisition | As low as possible (<$0.01) | You absorb the cost |
| Low-value B2C | <$0.02 | Customer pays $5-10/month |
| High-value B2B | <$0.50 | Customer pays $500-2000/month |
| Enterprise (custom model) | <$2.00 | Customer pays $10k+/month |
How to improve CPI:
| Tactic | Effort | Impact |
|---|---|---|
| Switch to cheaper model (GPT-4o mini vs GPT-4o) | Low | 20-50x reduction |
| Cache common responses | Medium | 50-80% reduction |
| Optimize prompt length (fewer tokens) | Low | 10-30% reduction |
| Self-host open source model | High | 70-90% reduction (but upfront cost) |
| Batch inferences (process in bulk) | Medium | 20-40% reduction |
The catch:
CPI is not static. It changes with model version, API pricing updates, and your optimization efforts. Track it weekly.
Metric #2: Gross Margin per Inference (Not Just Overall Gross Margin)
What it is:
Your gross margin calculated at the individual inference level, not the company level. Revenue from an inference minus cost of that inference.
How to calculate it:
Gross Margin per Inference = (Revenue per inference − Cost per inference) ÷ Revenue per inference
Why it matters:
Overall gross margin can look healthy while your highest-usage customers are losing you money.
| Customer | Monthly revenue | Inferences | Cost (@ $0.05 each) | Gross margin |
|---|---|---|---|---|
| Small user | $50 | 500 | $25 | 50% |
| Power user | $200 | 8,000 | $400 | -100% |
| Average | $125 | 4,250 | $212.50 | -70% |
The average looks bad. But the real problem is that your power users are destroying you. And you would not know it without per-inference margin tracking.
What to watch for:
| Signal | What it means | Action |
|---|---|---|
| Margin decreases as customer usage increases | Your pricing is not usage-based enough | Switch to hybrid pricing (base + usage overage) |
| Margin varies wildly by customer segment | Different use cases have different costs | Segment your pricing by usage pattern |
| Margin positive for small users, negative for large | Large users are over-consuming | Implement usage tiers or throttling |
How to implement:
Tag every inference with:
- Customer ID
- Model used (GPT-4o vs GPT-4o mini vs Claude)
- Prompt length (token count)
- Use case (summarization vs chat vs analysis)
Aggregate by customer weekly. Flag any customer with negative gross margin.
The catch:
This requires good instrumentation. You need to track costs at the inference level. Most AI startups do not. Add request_id, customer_id, model_used, token_count, and cost columns to your inference logs today.
Metric #3: Unit Cost Trend Over Time (Moore's Law for AI)
What it is:
The rate at which your cost per inference is decreasing (or increasing) over time.
How to calculate it:
Compare CPI this month to CPI three months ago, six months ago.
Unit Cost Trend = (CPI_current − CPI_previous) ÷ CPI_previous × 100
Why it matters:
AI model costs are falling rapidly. GPT-4 in March 2023 cost $0.03 per 1K input tokens. GPT-4o mini in July 2024 cost $0.00015 per 1K input tokens. A 200x decrease in 16 months.
If your CPI is not falling, you are doing something wrong. Or you are locked into an expensive provider.
What a healthy trend looks like:
| Timeline | Expected CPI decrease | Source |
|---|---|---|
| 3 months | 10-20% | Provider price cuts, your optimizations |
| 6 months | 30-50% | Model upgrades (4o → 4o mini → next gen) |
| 12 months | 70-90% | Multiple generations of model improvement |
What to watch for:
| Signal | What it means | Action |
|---|---|---|
| CPI flat or increasing | You are not optimizing | Audit model choices, prompt lengths |
| CPI decreasing slower than market | You are on the wrong model or provider | Evaluate alternatives |
| CPI decreasing but usage increasing faster | Fixed costs still high | Switch to pay-as-you-go or scale fixed costs |
The real-world impact:
A startup I advised was using GPT-4 for all use cases. Their CPI was $0.08. They switched to GPT-4o mini for 80% of their traffic (where quality difference was unnoticeable). CPI dropped to $0.02. Their gross margin went from 40% to 78% in one week.
The catch:
Unit cost trend is not automatic. You must actively migrate to cheaper models, optimize prompts, and renegotiate with providers. If you do nothing, your CPI will not fall.
Metric #4: Customer Acquisition Cost (CAC) with AI Hype Premium Adjusted
What it is:
Your CAC, but with a crucial adjustment: remove customers acquired through "AI hype" who will not stick around.
How to calculate it:
Adjusted CAC = (Total sales and marketing spend) ÷ (Number of customers who survive 90 days)
Why it matters:
AI startups have a unique problem. People try your product because AI is cool. They tell their friends. Your user numbers look amazing. Your CAC looks low.
Then the hype fades. The novelty wears off. And you discover that 70% of those users never had a real problem you solved. They were just curious.
If you calculate CAC on all signups, you will think you have a sustainable acquisition engine. You do not. You have a hype wave. And it will crash.
The real-world impact:
An AI writing assistant startup spent $50,000 on ads. They got 10,000 signups. CAC = $5. Amazing!
Ninety days later, 9,200 of those signups had churned. Paid customers: 80. True CAC = $50,000 / 80 = $625.
Not so amazing.
They stopped advertising. They rebuilt their product for a specific niche (real estate agents). Their true CAC dropped to $200. And those customers stayed.
What is a healthy adjusted CAC?
| Business model | Healthy adjusted CAC |
|---|---|
| Low-touch B2C (self-serve) | $10–50 |
| High-touch B2C (onboarding) | $50–200 |
| Low-touch B2B | $200–1,000 |
| High-touch B2B (sales-led) | $1,000–10,000 |
How to improve it:
| Tactic | Effort | Impact |
|---|---|---|
| Target specific verticals, not "everyone with AI" | Medium | High |
| Require credit card for free trial | Low | Filters curiosity users |
| Shorten free trial to 7 days | Low | Faster conversion or churn |
| Add qualification questions to signup | Low | Reduces junk signups |
| Focus on retention, not acquisition | High | Better CAC over time |
The catch:
This metric is painful to calculate because it requires waiting 90 days. Do it anyway. Track cohorts. Compare adjusted CAC month over month. Watch for hype-induced bubbles.
Metric #5: Data Flywheel Efficiency (How Much Better Your Model Gets Per User)
What it is:
A measure of how much your model improves for every user interaction. The core advantage of AI startups is supposed to be the data flywheel: more users → more data → better model → better product → more users.
Most AI startups do not actually have this. Or they cannot measure it.
How to calculate it:
This is harder than the other metrics because it requires model evaluation. But here is a proxy:
Data Flywheel Efficiency = (Model performance improvement over N users) ÷ N
Practical proxy (for startups without dedicated ML teams):
| Proxy metric | How to measure |
|---|---|
| User preference | % of users who prefer new model version over old in A/B tests |
| Task completion rate | % of tasks completed successfully (requires human eval or proxy) |
| Retry rate | % of inferences where user re-prompts or edits output (lower is better) |
| Feedback data collected | % of inferences with user thumbs up/down |
Why it matters:
If your model does not improve with more users, you do not have a data flywheel. You have a linear business dressed up as an AI company. And you will be outcompeted by anyone who does have a flywheel.
What a healthy flywheel looks like:
| Stage | Monthly users | Model improvement per 10k users |
|---|---|---|
| Early (0-10k users) | High improvement (new scenarios discovered) | 5-10% |
| Growth (10k-100k) | Medium improvement (edge cases refined) | 1-2% |
| Mature (100k+) | Low improvement (diminishing returns) | 0.1-0.5% |
What to watch for:
| Signal | What it means | Action |
|---|---|---|
| No measurable improvement with scale | You are not using user data for fine-tuning | Start collecting feedback, run fine-tuning experiments |
| Improvement only from manual labeling (not user signals) | Flywheel not automated | Build feedback loops into product |
| Improvement but cost per improvement is too high | Fine-tuning ROI negative | Evaluate cheaper fine-tuning methods (LoRA, PEFT) |
The catch:
Small startups cannot afford large-scale fine-tuning. That is fine. You can still collect data and measure. The flywheel is not just about model weights. It is about understanding what users actually want.
Metric #6: Prompt Efficiency (Token Economy)
What it is:
The average number of input tokens and output tokens per successful inference. You pay for both. Many startups ignore output tokens entirely.
How to calculate it:
Prompt Efficiency = (Average input tokens + Average output tokens) per inference
Breakdown:
| Metric | What it measures | Typical range |
|---|---|---|
| Input tokens | Your prompt + retrieved context (RAG) | 500-5,000 |
| Output tokens | Model's response | 100-2,000 |
| Total | Your cost basis | 600-7,000 |
Why it matters:
Most AI startups write long, verbose prompts. They include entire documentation. They add "think step by step" (which adds tokens). They use 20-shot examples (more tokens).
Every extra token costs money. Over thousands of inferences per day, those tokens add up to real cash.
The real-world impact:
A startup using RAG (retrieval-augmented generation) was embedding 10 documents of 800 tokens each into every prompt. Input tokens: 8,000 per inference. At $0.15 per 1K input tokens (GPT-4o), each inference cost $1.20.
They optimized: retrieved only 3 documents, summarized them before embedding, and used GPT-4o mini. Input tokens: 1,200. Cost per inference: $0.003.
A 400x cost reduction. Same user satisfaction (they tested).
What is healthy prompt efficiency?
| Use case | Target input tokens | Target output tokens | Notes |
|---|---|---|---|
| Simple classification | 200-500 | 10-50 | Just a label or boolean |
| Chat (general) | 500-2,000 | 100-500 | Normal conversation |
| Summarization | 500-3,000 | 200-1,000 | Depends on source length |
| RAG (multiple documents) | 1,000-4,000 | 300-1,500 | Needs enough context |
| Code generation | 500-2,000 | 200-1,500 | Depends on task |
How to improve prompt efficiency:
| Tactic | Typical reduction |
|---|---|
| Remove unnecessary examples (use 1-2 shots, not 10) | 30-50% |
| Compress retrieved documents (extract only relevant sentences) | 50-70% |
| Use smaller model for simple tasks | 20-50x cheaper |
| Implement semantic caching (cache identical/similar prompts) | 50-90% on repeated queries |
| Use prompt compression techniques (LLMLingua, etc.) | 20-40% |
The catch:
Over-optimizing prompt efficiency can hurt quality. Test before you deploy. Run A/B tests. Measure user satisfaction against token count. Find the trade-off.
Metric #7: Model Downgrade Tolerance (The Cheaper Model Index)
What it is:
A measure of what percentage of your traffic can be handled by a cheaper, smaller, faster model without a meaningful drop in user satisfaction.
How to calculate it:
Model Downgrade Tolerance = % of inferences where (User satisfaction with cheaper model) ≥ (User satisfaction with expensive model) − 5%
Why it matters:
The price difference between frontier models (GPT-4o, Claude 3.5 Opus) and efficient models (GPT-4o mini, Claude 3.5 Haiku, Llama 3 8B) is massive.
| Model | Input price per 1M tokens | Relative cost |
|---|---|---|
| GPT-4o | $2.50 | 100x |
| Claude 3.5 Opus | $15.00 | 600x |
| GPT-4o mini | $0.15 | 1x (baseline) |
| Claude 3.5 Haiku | $0.25 | 1.6x |
| Llama 3 70B (self-hosted) | ~$0.10 | 0.7x |
If 80% of your traffic can use GPT-4o mini instead of GPT-4o, your cost drops by 80%.
The real-world impact:
A customer support automation startup was using GPT-4o for every ticket. Their CPI was $0.50. They analyzed their traffic:
| Ticket type | % of volume | GPT-4o mini quality rating (vs GPT-4o) | Can downgrade? |
|---|---|---|---|
| Simple FAQ | 60% | 98% | Yes |
| Account changes | 20% | 95% | Yes |
| Technical troubleshooting | 15% | 80% | Maybe (test) |
| Angry/critical | 5% | 60% | No |
They routed 80% of traffic to GPT-4o mini. Their CPI dropped to $0.15. Their gross margin doubled.
How to measure downgrade tolerance:
| Step | Method | Effort |
|---|---|---|
| 1. Run side-by-side evaluation | Take 100 sample inferences, run both models, compare outputs | 1 day |
| 2. User preference A/B test | Route random % of traffic to cheaper model, measure satisfaction | 1-2 weeks |
| 3. Implement dynamic routing | Route based on task complexity (short prompt → cheaper model) | 1-2 weeks |
| 4. Continuous monitoring | Detect when cheaper model quality drops (model drift) | Ongoing |
What a healthy tolerance looks like:
| AI startup type | Typical downgrade tolerance | Why |
|---|---|---|
| Chat / conversational | 30-50% | Many simple queries, some complex |
| Summarization (short docs) | 70-90% | Cheaper models handle short docs well |
| Summarization (long docs) | 20-40% | Frontier models still better for long context |
| Classification | 90-95% | Small models excellent at classification |
| Code generation | 40-60% | Depends on complexity |
| RAG / QA | 50-70% | Cheaper models good if retrieval is solid |
The catch:
Model downgrade tolerance changes over time. Cheaper models get better every few months. Re-evaluate quarterly. What could not be downgraded in January might be fine in April.
How to Build Your AI Startup Dashboard
You do not need 20 charts. You need one page with these seven metrics.
| Metric | Target (Early Stage) | Target (Growth) | Current | Action if off |
|---|---|---|---|---|
| Cost Per Inference (CPI) | <$0.05 | <$0.02 | $0.08 | Optimize model choice |
| Gross Margin per Inference | >50% | >70% | -10% | Increase price or reduce cost |
| Unit Cost Trend (3 months) | -20% | -30% | +5% | Audit model upgrades |
| Adjusted CAC (90-day) | <$100 | <$50 | $400 | Target specific verticals |
| Data Flywheel Efficiency | Improving | Stable | Flat | Build feedback loops |
| Prompt Efficiency (tokens) | <2,000 | <1,000 | 4,500 | Compress prompts |
| Model Downgrade Tolerance | >60% | >70% | 30% | Test cheaper models |
Update weekly for CPI, prompt efficiency, and gross margin. Update monthly for trend and downgrade tolerance. Update quarterly for adjusted CAC and flywheel efficiency.
Realistic Timeline: Implementing These Metrics
Week 1 (4 hours):
- Add inference logging (customer_id, model, tokens, cost)
- Calculate your current CPI and gross margin per inference
- You will likely be shocked. That is normal.
Week 2 (4 hours):
- Measure prompt efficiency (average tokens per inference)
- Run a side-by-side evaluation of GPT-4o vs GPT-4o mini on 100 samples
- Calculate your current downgrade tolerance
Week 3 (4 hours):
- Calculate adjusted CAC (requires 90-day window – use historical data if available)
- If no historical data, set up tracking for future cohorts
- Identify your lowest-margin customer segment
Week 4 (4 hours):
- Implement dynamic model routing (simple rules first)
- Start collecting user feedback signals
- Build the dashboard (Google Sheets or Notion is fine to start)
Ongoing:
- Review dashboard weekly (30 minutes)
- Run downgrade tolerance re-evaluation quarterly
- Watch for negative gross margin per customer
Frequently Asked Questions
Can AI startups use standard SaaS metrics?
Yes, but not alone. MRR and churn matter. But they tell you nothing about unit economics. Track SaaS metrics AND AI-specific metrics together.
What is a healthy gross margin for an AI startup?
For a sustainable business, target 70%+ gross margin. Some AI startups operate at 30-50% and survive by making it up in volume or having other advantages (data moat, unique IP). But 70%+ is where you want to be.
Should we self-host or use APIs?
| Factor | Use APIs | Self-host |
|---|---|---|
| Early stage (MVP) | ✅ | ❌ |
| High scale (>1M inferences/day) | ❌ | ✅ |
| Sensitive data (healthcare, finance) | ❌ (unless using enterprise API agreement) | ✅ |
| Need cutting-edge models | ✅ (open source models lag frontier by 6-12 months) | ❌ |
| Cost-sensitive | ❌ (APIs have markup) | ✅ |
Most startups should start with APIs, then migrate to self-hosting for high-volume, non-cutting-edge workloads.
How do we track costs per inference without building custom infrastructure?
- If using OpenAI/Anthropic API: They return token counts in the response. Log them. Multiply by current pricing.
- If using self-hosted GPUs: Divide your monthly GPU cost by number of inferences. Less precise, but works.
- Tools: Helicone, LangSmith, Portkey – purpose-built for AI observability and cost tracking.
What about fine-tuning costs? How do we amortize them?
Spread the cost of fine-tuning over the expected number of inferences that will use the fine-tuned model.
Example: Fine-tuning costs $500. You expect 50,000 inferences on the fine-tuned model. Add $0.01 per inference to CPI for six months.
Is it worth switching to cheaper models if quality drops 5%?
Depends on your use case and business model.
| Quality drop | Cost reduction | Decision |
|---|---|---|
| 1-2% | 10x | Always switch |
| 5% | 10x | Test. Users often do not notice. |
| 10% | 10x | Maybe not. Run A/B test. |
| Any drop | <2x | Not worth it. |
Test before switching. Run A/B tests. Measure user satisfaction. Let the data decide.
The Bottom Line
Here is the honest truth about AI startups in 2026.
The hype is fading. The VCs are getting picky. The free money is gone.
The AI startups that survive will not be the ones with the most PhDs or the most impressive demos. They will be the ones with the best unit economics.
They will know their cost per inference to the tenth of a cent. They will know which customers are profitable and which are burning cash. They will switch between models dynamically based on task complexity. They will optimize every token. They will track their data flywheel and measure whether more users actually make their product better.
The seven metrics above are not optional. They are not "nice to have." They are the difference between a business and a bonfire of VC cash.
Start tracking CPI today. You are probably losing money on your best customers. You just did not know it.
Now you do.
– Written by Fredsazy

Iria Fredrick Victor
Iria Fredrick Victor(aka Fredsazy) is a software developer, DevOps engineer, and entrepreneur. He writes about technology and business—drawing from his experience building systems, managing infrastructure, and shipping products. His work is guided by one question: "What actually works?" Instead of recycling news, Fredsazy tests tools, analyzes research, runs experiments, and shares the results—including the failures. His readers get actionable frameworks backed by real engineering experience, not theory.
Share this article:
Related posts
More from AI
May 27, 2026
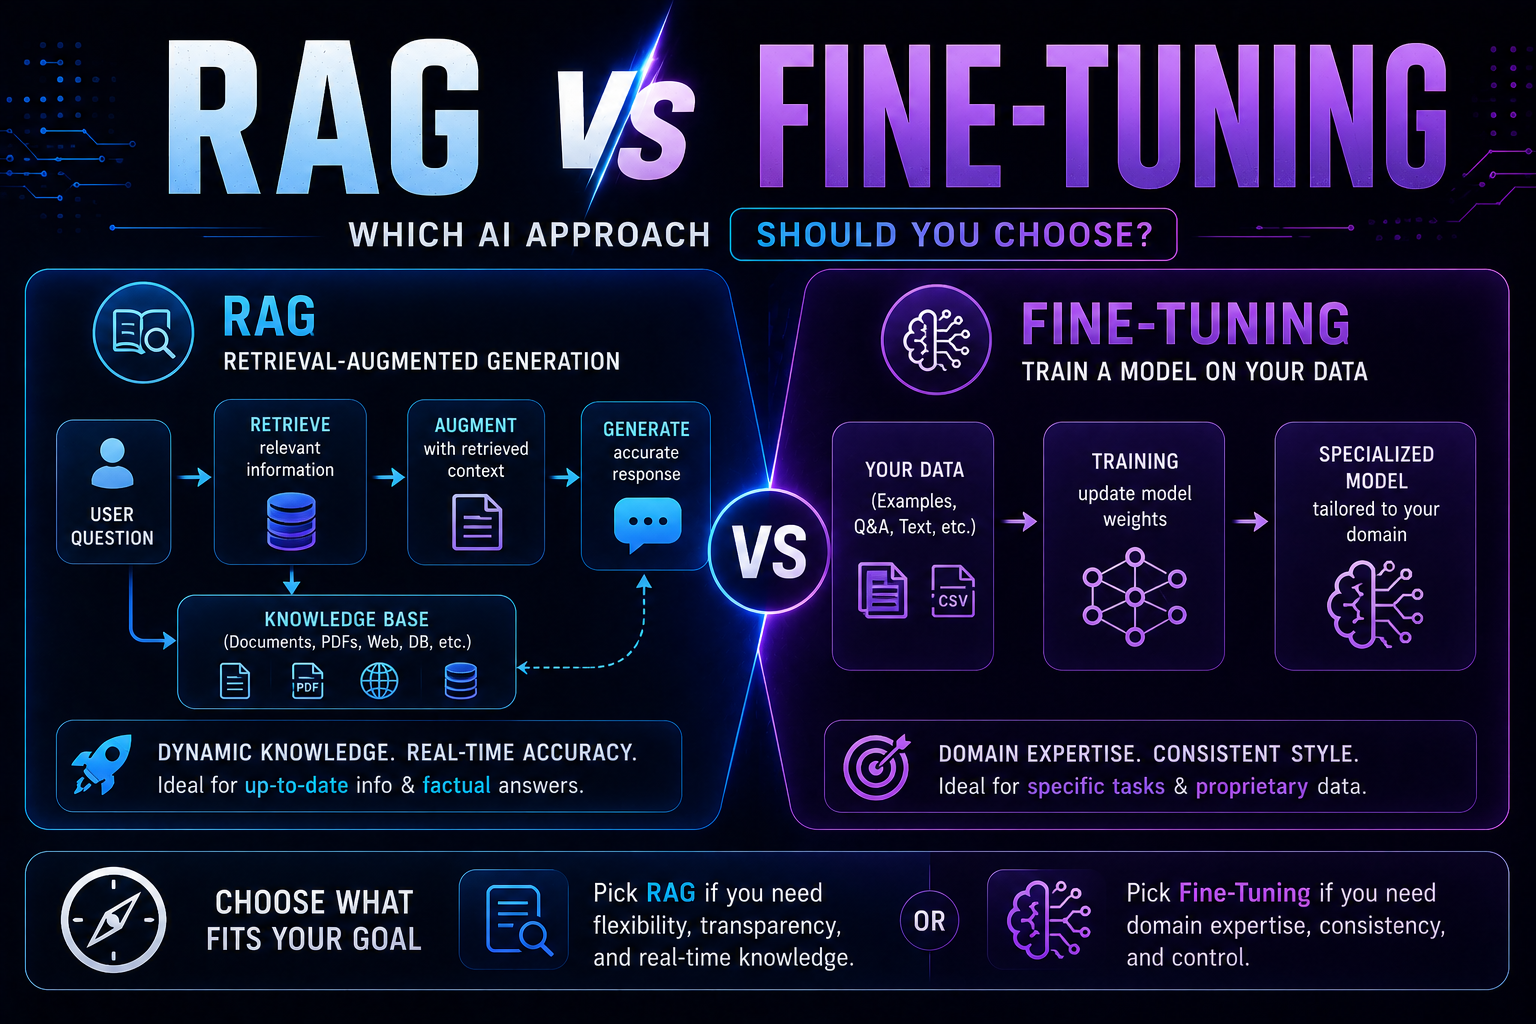
93RAG vs fine-tuning in 2026 — a practical guide covering when to use each, how both work with real code examples, the form vs facts distinction, hybrid approaches, true costs, and a decision framework to choose the right AI architecture for your use case.
May 22, 2026
1005 red flags every business must spot before buying AI software — covering demo manipulation, data privacy gaps, missing error handling, AI-washing, and lock-in contracts, with a 4-week vendor evaluation framework.

May 13, 2026
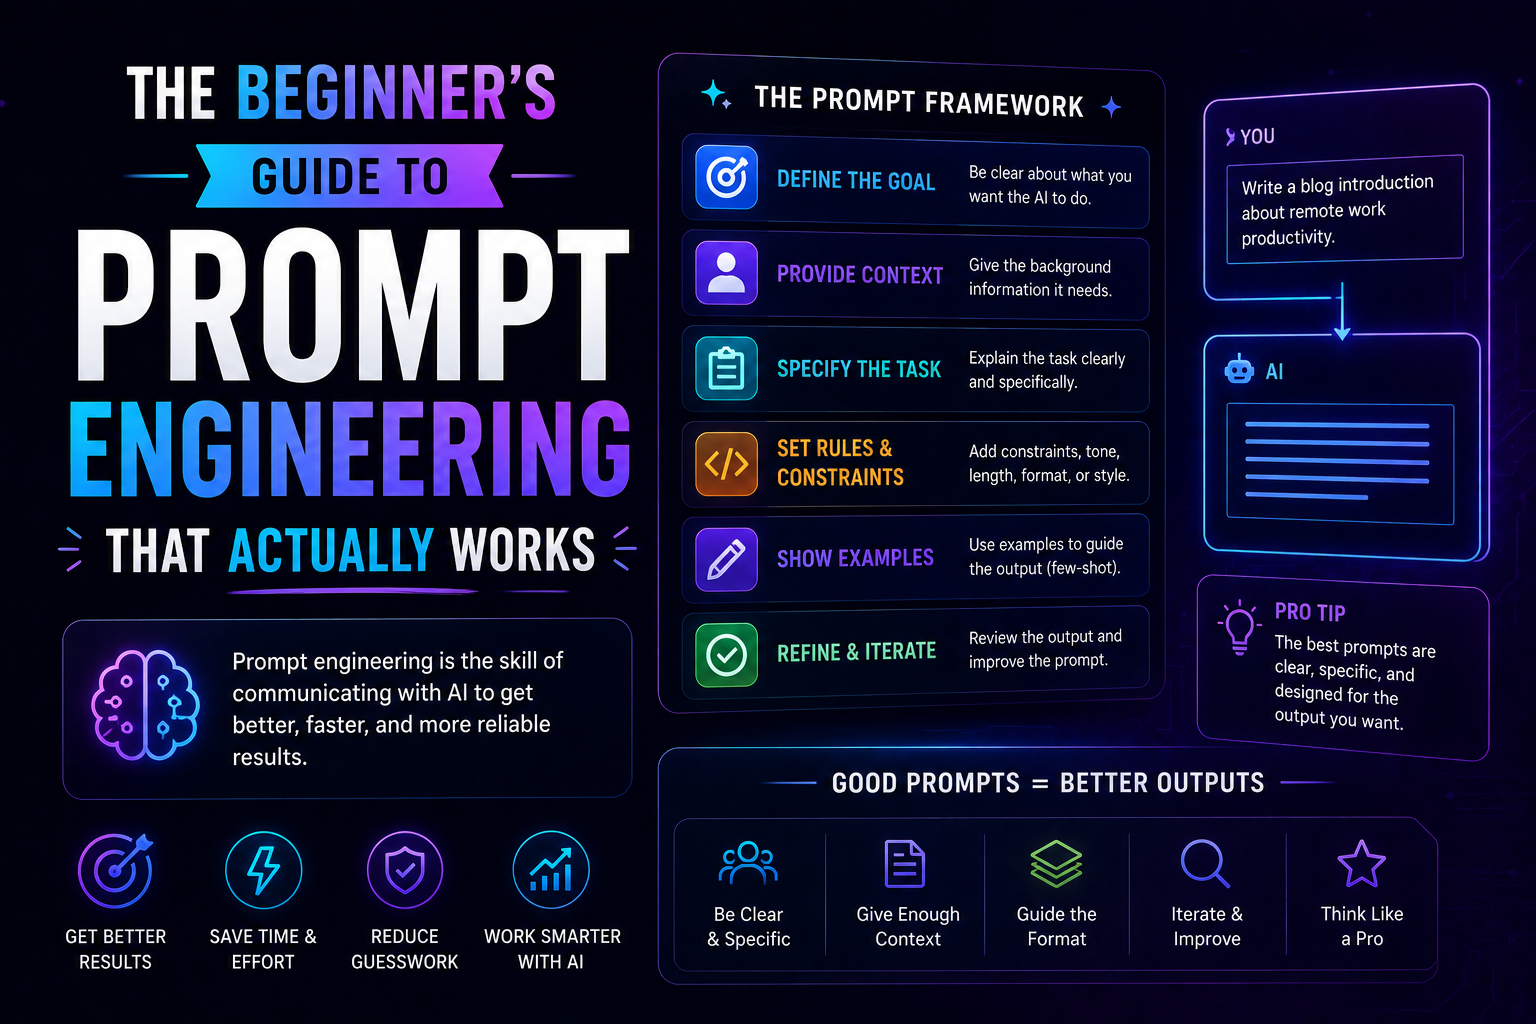
135The beginner's guide to prompt engineering that actually works in 2026 — covering the RCTF framework, chain of thought, few-shot examples, output contracts, and model-specific tips for Claude, GPT-5, and Gemini.