How to Read a Stack Trace Without Panicking
That wall of red text is trying to help you. Here's how to read a stack trace calmly — and actually find the bug.

That moment when everything turns red.
You run your code. Something breaks. The terminal explodes with lines of text. Red text. Lots of it.
Your heart rate spikes.
You scan frantically for something that looks familiar. You don't find it. You copy the whole thing into Google. Nothing helpful comes back.
So you stare at it. Hoping it will make sense. It doesn't.
I've been there. Hundreds of times.
Here's what I've learned: the stack trace is not the enemy. It's a map. You just need to know how to read it.
Let me teach you. Once you understand what you're looking at, that wall of red becomes your best debugging friend.
What a Stack Trace Actually Is
A stack trace is a report of where your program was when it crashed.
That's it. No mystery.
Every time your code calls a function, that function gets added to the "call stack." When a function finishes, it gets removed.
If something crashes (error, exception, segfault), the program dumps the current call stack. Right now. At the moment of failure.
The stack trace shows you the chain of function calls that led to the crash.
It's like a breadcrumb trail. "You were here. Then you went here. Then here. Then something broke."
The Anatomy of a Stack Trace
Let me show you a real example. Python, but the pattern is the same in almost every language.
Traceback (most recent call last):
  File "/app/main.py", line 15, in <module>
    process_order(order_id)
  File "/app/orders.py", line 42, in process_order
    calculate_total(items)
  File "/app/pricing.py", line 18, in calculate_total
    price = item.price * quantity
AttributeError: 'NoneType' object has no attribute 'price'
Here's what each part means.
Line 1: Traceback (most recent call last):
- This is just a header. Ignore it.
Line 2: File "/app/main.py", line 15, in <module>
- The first place your code was running. The main script.
- File:
main.py - Line number:
15 - Function:
<module>(the main script, not inside a function)
Line 3: process_order(order_id)
- This is the actual code that was running. It called
process_orderwithorder_id.
Line 4: File "/app/orders.py", line 42, in process_order
- Now we're inside
orders.py - Line
42 - Function
process_order
Line 5: calculate_total(items)
- Inside
process_order, it calledcalculate_total(items)
Line 6: File "/app/pricing.py", line 18, in calculate_total
- Now we're inside
pricing.py - Line
18 - Function
calculate_total
Line 7: price = item.price * quantity
- This is the actual line of code that crashed.
Line 8: AttributeError: 'NoneType' object has no attribute 'price'
- The error type and message.
AttributeErroris the type of error'NoneType' object has no attribute 'price'means you tried to access.priceon something that isNone
The Strategy: Read From Bottom to Top
Most people read top to bottom. That's wrong.
Read from bottom to top.
The bottom is where the crash actually happened. That's your starting point.
Let me demonstrate with the example above.
Step 1: Look at the very last line.
AttributeError: 'NoneType' object has no attribute 'price'
Something is None. You tried to read .price on it.
Step 2: Look at the line above it (the line that crashed).
price = item.price * quantity
The crash happened on this line. item is None. That's why you can't read item.price.
Step 3: Look up one more line to see where that variable came from.
File "/app/pricing.py", line 18, in calculate_total
You're in calculate_total, line 18. The item variable was passed into this function.
Step 4: Trace back to find out why item is None.
Now you know:
- Something called
calculate_totalwith anitemthat wasNone - You need to find out why that
itemwasNone
You look at the line above: calculate_total(items) called from orders.py, line 42.
You go to orders.py, line 42. See what items is. Maybe items is an empty list. Maybe an API returned nothing. Maybe something deleted the item before you got to it.
The stack trace told you exactly where to look.
The Three Most Important Lines
Not every line in a stack trace matters. Here's what to focus on.
1. The error message (very bottom)
This tells you what went wrong.
Common ones:
AttributeError: 'NoneType' object has no attribute 'xxx'→ You forgot to initialize something. It's None.KeyError: 'xxx'→ A dictionary is missing a key you expected.IndexError: list index out of range→ You tried to access element 5 of a list with 3 items.TypeError: can only concatenate str (not "int") to str→ Mixed data types. Number + string.ImportError: No module named 'xxx'→ Typo in import, or package not installed.FileNotFoundError: [Errno 2] No such file or directory→ File path is wrong.
2. The line of code that crashed (one line above the error)
This is where the program stopped. Start debugging here.
3. The first line of your code (somewhere in the middle)
Stack traces often include internal library code. Ignore those.
Look for the first line that points to a file YOU wrote. That's usually where your bug started.
In the example:
- Line 2:
main.py(your code) - Line 4:
orders.py(your code) - Line 6:
pricing.py(your code)
All your code. Good. If you see something like python3.9/site-packages/requests/models.py, that's a library. Skip it. Focus on your files.
Real Examples From Different Languages
The concept is the same. The format changes slightly.
JavaScript (Node.js):
TypeError: Cannot read property 'price' of undefined
    at calculateTotal (/app/pricing.js:18:15)
    at processOrder (/app/orders.js:42:10)
    at Object.<anonymous> (/app/main.js:15:5)
Same pattern:
- Bottom: actual error
- Above: where it crashed (line 18 in pricing.js)
- Above that: who called it (line 42 in orders.js)
Java:
Exception in thread "main" java.lang.NullPointerException
    at com.app.pricing.calculateTotal(pricing.java:18)
    at com.app.orders.processOrder(orders.java:42)
    at com.app.main.main(main.java:15)
Same pattern. Read bottom to top.
Ruby:
Traceback (most recent call last):
    1: from main.rb:15:in `<main>'
    2: from orders.rb:42:in `process_order'
    3: from pricing.rb:18:in `calculate_total'
pricing.rb:18:in `calculate_total': undefined method `price' for nil:NilClass (NoMethodError)
Same pattern. Bottom line is the error. The lines above show the call chain.
What To Do When You See a Stack Trace
Don't panic. Follow this checklist.
Step 1: Read the error message at the bottom.
Understand what kind of error it is.
Step 2: Find the line of code that crashed.
Look for a file name and line number that belongs to YOUR code.
Step 3: Open that file. Go to that line.
Look at the code that broke.
Step 4: Identify the variable or operation that caused the error.
Noneorundefined→ something wasn't initializedKeyError→ a dictionary key is missingIndexError→ list index is too high
Step 5: Trace backward to find out why that variable had the wrong value.
Look at where that variable came from. What function called this one? What argument was passed?
Step 6: Add a print or log statement if needed.
If you still can't see the problem, print the variable right before the crash.
print(f"item is: {item}, type is: {type(item)}")
price = item.price * quantity
Run it again. See what's actually there.
Step 7: Fix the root cause, not the symptom.
Don't just add if item is not None. Figure out why item was None in the first place. Fix that.
The One Line That Tricks Everyone
Look at this:
  File "/app/main.py", line 15, in <module>
    process_order(order_id)
Many beginners see <module> and think "that's not my code." But it is.
<module> just means code that's not inside a function. The main script. The top level.
Don't skip it. That's your code.
When the Stack Trace Is Huge
Sometimes you'll see 50+ lines. Most of them are internal library code.
Don't panic. Here's what to do:
1. Ignore everything below the first line of your code.
If you see node_modules/, site-packages/, vendor/, or anything that's not your project, skip it.
2. Find the highest line (closest to the top) that points to your code.
That's where your code started the chain. Start there.
3. Work downward from that line to the crash.
You don't need to read every library line. Just know that your code called some library, which called more libraries, until something broke.
Real Debugging Example
Let me walk through a real debugging session.
You see this:
Traceback (most recent call last):
  File "/app/api.py", line 23, in get_user_data
    user = fetch_from_db(user_id)
  File "/app/database.py", line 56, in fetch_from_db
    result = connection.execute(query)
  File "/app/connection.py", line 89, in execute
    return self.cursor.fetchall()
  File "/usr/lib/python3.10/sqlite3/dbapi2.py", line 64, in fetchall
    return list(self._rows)
TypeError: 'NoneType' object is not iterable
Read bottom to top:
- Error:
TypeError: 'NoneType' object is not iterable→ something is None when we expected a list - Crashed at
dbapi2.py, line 64 → that's a library (sqlite3). The bug is not there. - Look up: called from
connection.py, line 89 →return self.cursor.fetchall() - Look up: called from
database.py, line 56 →result = connection.execute(query) - Look up: called from
api.py, line 23 →user = fetch_from_db(user_id)
Now you know: The bug is that fetch_from_db returned None instead of data. Go to database.py, line 56. Check why connection.execute(query) returned None.
Maybe the query didn't match any records. Maybe the connection was closed. Maybe the table doesn't exist.
The stack trace told you exactly where to look.
The Bottom Line
A stack trace is not a punishment. It's information.
- Read bottom to top
- Focus on your code's file names
- The error message tells you what broke
- The line numbers tell you where
- The call chain tells you how you got there
Once you learn to read them, stack traces save you hours of guessing.
Next time everything turns red, don't panic.
Read the bottom line first.
Written by Fredsazy — because understanding errors is a superpower.

Iria Fredrick Victor
Iria Fredrick Victor(aka Fredsazy) is a software developer, DevOps engineer, and entrepreneur. He writes about technology and business—drawing from his experience building systems, managing infrastructure, and shipping products. His work is guided by one question: "What actually works?" Instead of recycling news, Fredsazy tests tools, analyzes research, runs experiments, and shares the results—including the failures. His readers get actionable frameworks backed by real engineering experience, not theory.
Share this article:
Related posts
More from Software
May 27, 2026
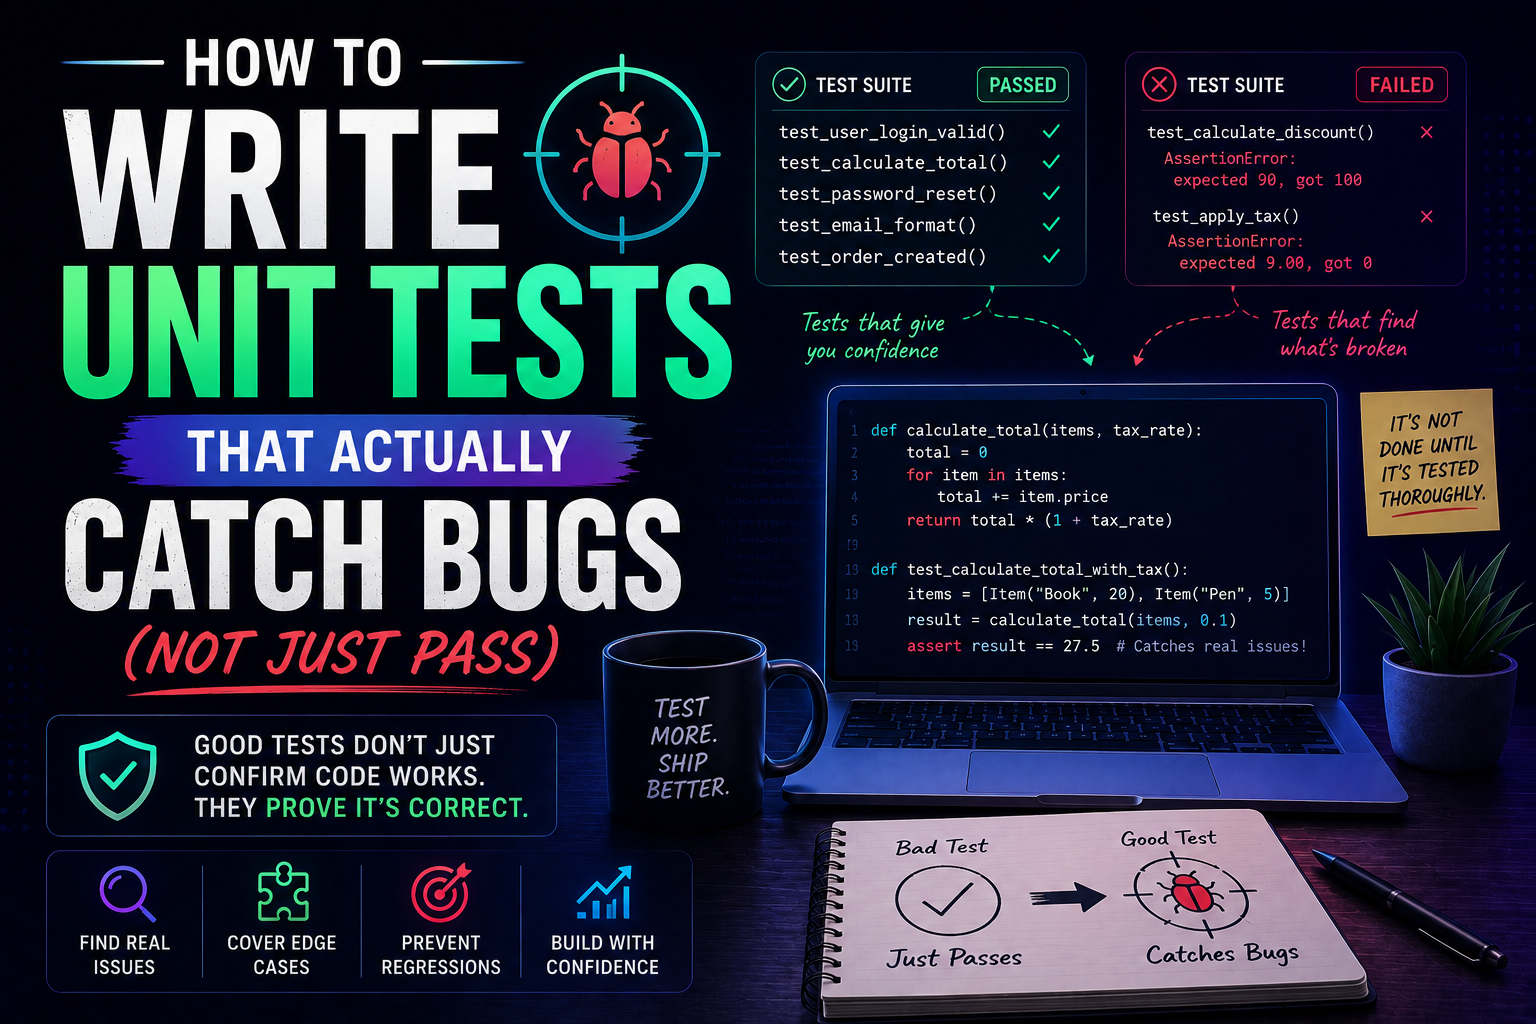
143Learn how to write unit tests that actually catch bugs — not just pass. Covers the AAA pattern, behaviour vs implementation testing, edge cases, test doubles, mutation testing, and a pre-commit checklist for writing tests that protect production.
May 22, 2026
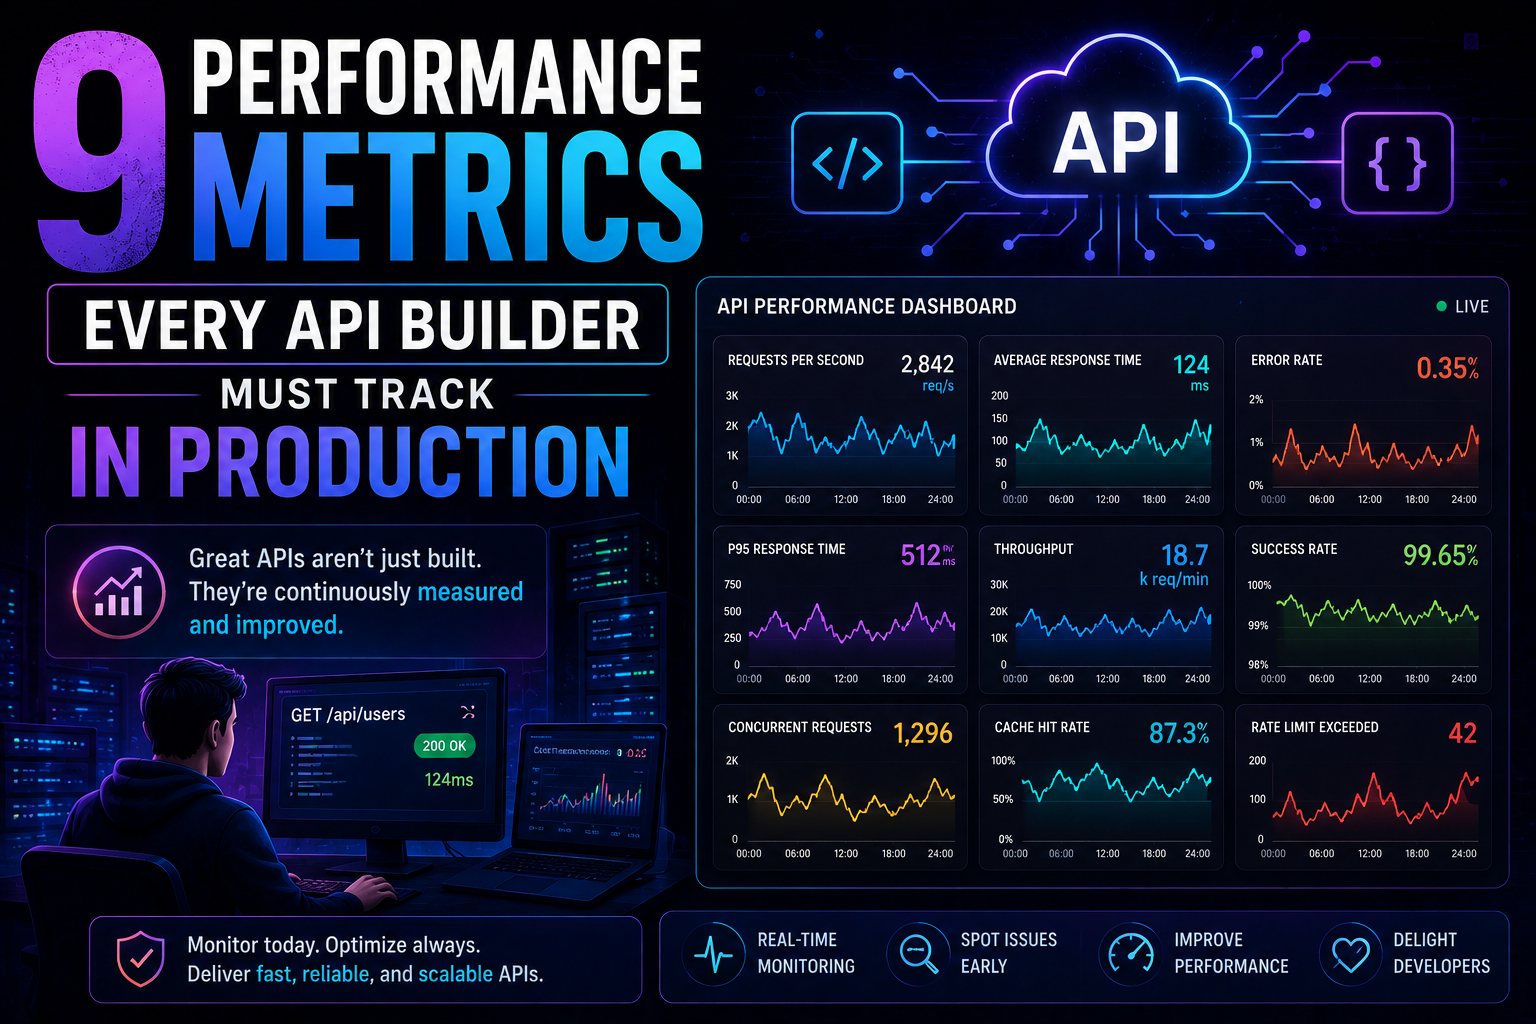
183Latency percentiles. Dependency health. Connection pool saturation. Idempotency success. 9 production metrics every API builder needs – with benchmarks, alert thresholds, and real-world failures prevented.
May 13, 2026
229PostgreSQL vs MongoDB in 2026 — an honest comparison covering benchmarks, data modelling, ACID transactions, scaling, pgvector vs Atlas Vector Search, pricing, and a decision framework for your project.