9 Performance Metrics Every API Builder Must Track in Production
Latency percentiles. Dependency health. Connection pool saturation. Idempotency success. 9 production metrics every API builder needs – with benchmarks, alert thresholds, and real-world failures prevented.

Your API is working. That is not the same as your API performing.
I have seen this mistake more times than I can count. A team deploys an API. The tests pass. The integration works. The happy path returns 200 OK. They pop champagne and move on to the next feature.
Then production happens. Real users. Real networks. Real scale.
The API that worked perfectly in staging falls over at 50 requests per second. Latency spikes from 50ms to 5 seconds. The database connection pool exhausts. Endpoints that used to return in 200ms now timeout at 30 seconds.
And the team has no idea why. Because they were not tracking the right metrics.
This is not a hypothetical. I have debugged production API failures at 2 AM. I have watched founders lose customers because their API got slow and they did not notice until churn arrived. I have seen the post-mortems where the root cause was always the same: we were not measuring performance in production.
This guide is for you if you are building APIs that real people depend on. Not "it works on my machine." Not "we will monitor later." Production. Now.
Here are the nine metrics you must track – with benchmarks, alerting thresholds, and the real-world failures they prevent.
The fundamental shift: from "works" to "works well enough, reliably enough, fast enough"
Before the metrics, understand the shift in thinking.
| Local/Staging mindset | Production mindset |
|---|---|
| "Does it return the right data?" | "Does it return the right data within 200ms, 99.9% of the time?" |
| "Does it handle 10 concurrent users?" | "Does it handle 10,000 concurrent users without degrading?" |
| "Is there a bug?" | "Is there a bug, a bottleneck, a timeout, or a cascade failure?" |
| "Did the test pass?" | "Did the SLO get violated?" |
Production performance is not about correctness. It is about reliability, latency, throughput, and graceful degradation.
Here are the nine metrics that tell you if you have those.
Metric #1: Latency (p50, p90, p95, p99)
What it is:
The time between a client sending a request and receiving the complete response. Measured at different percentiles – not just averages.
How to calculate it:
Collect response times for every request over a window (e.g., 1 minute). Sort them. Find the value at each percentile.
| Percentile | Meaning | Why it matters |
|---|---|---|
| p50 (median) | Half of requests faster, half slower | Tells you what "normal" feels like |
| p90 | 90% of requests faster than this | Reveals the slow tail for most users |
| p95 | 95% faster | Where most users start noticing |
| p99 | 99% faster | The unlucky 1%. Critical for SLAs |
| p99.9 | 0.1% of requests | The extreme outliers. Often indicates a bug or bottleneck |
Why averages lie:
| Scenario | Average latency | p99 latency | What actually happens |
|---|---|---|---|
| 99 requests at 100ms, 1 at 10,000ms | 199ms | 10,000ms | "Average looks fine. Users are timing out." |
| 50 requests at 50ms, 50 at 150ms | 100ms | 150ms | Good. No hidden problems. |
2026 benchmarks:
| API type | Good p95 | Good p99 | Excellent p99 |
|---|---|---|---|
| Cached read endpoint (CDN/database) | <50ms | <100ms | <50ms |
| Database-heavy read | <200ms | <500ms | <200ms |
| Write endpoint (create/update) | <300ms | <800ms | <300ms |
| Complex aggregation/analytics | <1s | <2s | <1s |
| AI/LLM endpoint (streaming) | <2s first token | <5s first token | <1s first token |
Alerting thresholds:
| Condition | Severity | Action |
|---|---|---|
| p95 > benchmark for 5 minutes | Warning | Investigate |
| p95 > 2x benchmark for 2 minutes | Critical | Page on-call |
| p99 > 3x benchmark for 1 minute | Critical | Immediate incident |
Real-world failure prevented:
A fintech API had p50 latency of 80ms – looked great. But p99 was 8 seconds. The average hid that 1% of users were timing out on every request. The cause? A single inefficient query that only ran for accounts with >1,000 transactions. Tracking p99 caught it. The average never would have.
Metric #2: Error Rate (and Error Type Breakdown)
What it is:
The percentage of requests that return an HTTP error status (4xx or 5xx) over a given window.
How to calculate it:
Error Rate = (Number of error responses ÷ Total requests) × 100
Break down by type – this is where the insight lives:
| Error range | Meaning | Typical acceptable rate |
|---|---|---|
| 4xx (client errors) | Bad request, unauthorized, not found | <1% (often user error, not API problem) |
| 5xx (server errors) | Internal error, timeout, unavailable | <0.1% (should be near zero) |
| 429 (rate limited) | Client hit rate limit | Depends on your policy. <0.5% is typical |
Why breakdown matters:
| What you see | What it likely means | Action |
|---|---|---|
| 5xx errors rising | Bug, database issue, dependency failure | Fix your code or infrastructure |
| 4xx errors rising | Bad client implementation, SDK bug, documentation gap | Talk to your API consumers |
| 429 errors rising | Rate limits too low OR a single client abusing | Adjust limits or contact the client |
2026 benchmarks:
| API maturity | 5xx error rate target | 4xx error rate target |
|---|---|---|
| Internal/development | <0.5% | No target (client controlled) |
| Beta/early access | <0.2% | <5% |
| Production (non-critical) | <0.1% | <2% |
| Production (critical, SLA-backed) | <0.01% | <1% |
Alerting thresholds:
| Condition | Severity | Action |
|---|---|---|
| 5xx rate >0.1% for 1 minute | Critical | Page immediately |
| 5xx rate >0.01% for 5 minutes | Warning | Investigate |
| 4xx rate >5% for 10 minutes | Info | Review client logs |
Real-world failure prevented:
A payment API saw 4xx errors jump from 1% to 8% over 2 hours. They almost ignored it ("client errors, not our problem"). But they dug in. The cause was a silent breaking change in an SDK that added a required field. Fixing the documentation and rolling back the change saved 200+ integration failures per hour.
Metric #3: Requests Per Second (RPS) – Actual vs Capacity
What it is:
The number of requests your API handles each second. Track both actual traffic and capacity (maximum your system can handle before degrading).
Why actual RPS alone is not enough:
| You track only actual RPS | You also track capacity RPS |
|---|---|
| "We are handling 500 RPS. Looks fine." | "We are handling 500 RPS. Our capacity is 600 RPS. A 20% spike will break us." |
How to measure capacity:
Run load tests regularly (weekly) to find your breaking point. Then set an alert at 70-80% of that capacity.
What to watch for:
| Signal | What it means | Action |
|---|---|---|
| RPS growing steadily | Success! | Plan capacity increases |
| RPS approaching 70% of capacity | Getting close | Start autoscaling or add servers |
| RPS approaching 90% of capacity | Danger zone | Immediate scale or rate limit |
| RPS flat but capacity dropped | Something changed (code deploy, DB migration) | Roll back or investigate |
2026 benchmarks (by API type):
| API type | Typical RPS (small scale) | Typical RPS (enterprise) | Alert at % of capacity |
|---|---|---|---|
| Internal B2B API | 10-100 | 1,000-5,000 | 70% |
| Public API (SaaS) | 100-1,000 | 5,000-50,000 | 75% |
| High-volume (stripe, twilio scale) | 1,000-10,000 | 100,000+ | 80% |
Alerting thresholds:
| Condition | Severity | Action |
|---|---|---|
| RPS > 70% of capacity for 2 minutes | Warning | Prepare to scale |
| RPS > 85% of capacity for 1 minute | Critical | Auto-scale or page on-call |
| RPS exceeds 100% of capacity | Emergency | Rate limiting activates; page immediately |
Real-world failure prevented:
A weather API had steady traffic of 200 RPS. Capacity was 400 RPS. No alerts. Then a major storm hit. News websites embedded the API. Traffic jumped to 3,000 RPS in 90 seconds. The API collapsed. 5xx errors hit 80%. The fix? Tracking capacity and setting an alert at 300 RPS would have given them 10 minutes to scale before the storm hit.
Metric #4: Time to First Byte (TTFB)
What it is:
The time between a client sending a request and receiving the first byte of the response body. It measures everything before your API sends data: DNS lookup, connection establishment, SSL handshake, routing, authentication, and initial processing.
Why it matters:
TTFB is the "waiting" time. Users cannot see progress. High TTFB feels broken, even if the rest of the response streams fast.
What influences TTFB:
| Factor | Impact | How to improve |
|---|---|---|
| Geographic distance | High | CDN, edge deployment, regional replicas |
| DNS lookup | Low-medium | Use fast DNS provider (Cloudflare, Route53) |
| SSL handshake | Medium | Enable TLS session resumption |
| Authentication (JWT verify, DB lookup) | Medium-High | Cache auth decisions, use faster auth (API keys) |
| Cold starts (serverless) | Very High | Provisioned concurrency, keep-warm pings |
2026 benchmarks:
| API type | Good TTFB | Excellent TTFB |
|---|---|---|
| Edge/CDN cached (Cloudflare, Fastly) | <20ms | <10ms |
| Regional (same continent as user) | <50ms | <30ms |
| Global (single origin, no CDN) | <150ms | <80ms |
| Serverless (Lambda, Cloud Functions) | <200ms (warm) | <100ms (warm) |
| Serverless (cold start) | <500ms | <300ms |
Alerting thresholds:
| Condition | Severity | Action |
|---|---|---|
| TTFB > 200ms for 5 minutes | Warning | Check routing, DNS, auth |
| TTFB > 500ms for 2 minutes | Critical | Investigate immediately |
| TTFB varies wildly by region | Warning | CDN misconfiguration or regional replica issues |
Real-world failure prevented:
A GraphQL API had p95 latency of 300ms – acceptable. But TTFB was 280ms. That meant almost all of the latency was before any data was processed. The culprit? A misconfigured load balancer that was terminating SSL, then re-establishing a new SSL connection to the backend. Removing the double-encryption dropped TTFB from 280ms to 40ms.
Metric #5: Dependency Health (Database, Cache, External APIs)
What it is:
Your API is only as fast as its slowest dependency. Track the latency and error rate of every external service your API calls.
What to monitor for each dependency:
| Dependency | Metrics to track | Alert if... |
|---|---|---|
| Database (PostgreSQL, MySQL) | Query latency, connection pool usage, deadlocks | Query >1s, pool >80% |
| Cache (Redis, Memcached) | Hit ratio, latency, memory usage | Hit ratio <70%, latency >10ms |
| Message queue (RabbitMQ, SQS) | Queue depth, processing lag | Lag >10 seconds |
| External API (Stripe, OpenAI, etc.) | Latency, error rate, rate limit usage | Latency >2x normal |
| Object storage (S3, R2) | Upload/download latency, error rate | Error rate >0.1% |
The cascade failure pattern:
Your API calls Database A (10ms). Database A calls External API B (300ms). Database A's connection pool fills up waiting on B. Your API times out waiting for Database A. Everything fails. You need visibility at every layer.
2026 benchmarks for dependencies:
| Dependency type | Good latency | Warning latency | Critical latency |
|---|---|---|---|
| Local database (same region) | <10ms | >50ms | >200ms |
| Cached read (Redis) | <5ms | >20ms | >100ms |
| External API (well-known, same region) | <200ms | >500ms | >2s |
| External API (global, e.g., OpenAI) | <800ms | >2s | >5s |
| Object storage (get/put) | <100ms | >300ms | >1s |
Alerting thresholds:
| Condition | Severity | Action |
|---|---|---|
| Any dependency latency >2x normal for 2 minutes | Warning | Investigate |
| Any dependency error rate >1% for 1 minute | Critical | Page on-call; consider circuit breaker |
| Database connection pool >85% | Warning | Add connections or optimize queries |
Real-world failure prevented:
An e-commerce API called a shipping rate calculator for every cart view. The shipping API had a p99 latency of 5 seconds. The e-commerce team did not monitor it. During Black Friday, the shipping API slowed to 15 seconds. The e-commerce API's connection pool exhausted. The entire checkout process failed for 4 hours. The fix? Caching shipping rates for 15 minutes and adding a circuit breaker that fell back to estimated rates.
Metric #6: Time to Recovery (TTR) and Failure Rate
What it is:
Time to Recovery (TTR) measures how long it takes to restore normal operation after a failure. Failure Rate measures how often failures occur (same as error rate, but tracked per endpoint).
Why these matter together:
| Low error rate + high TTR | High error rate + low TTR | High error rate + high TTR | Low error rate + low TTR |
|---|---|---|---|
| You fail rarely, but when you do, it takes hours to fix. Annoying but survivable. | You fail often, but fix quickly. Bad for user trust. | You fail often and fix slowly. You are losing customers. | The goal. |
How to track TTR:
- Incident starts: error rate crosses threshold
- Incident ends: error rate returns to normal for 5 minutes
- TTR = end time − start time
2026 benchmarks:
| API criticality | Acceptable failure rate | Acceptable TTR |
|---|---|---|
| Internal tool | <5% | <4 hours |
| B2B API (non-critical) | <1% | <1 hour |
| B2B API (critical) | <0.1% | <15 minutes |
| Consumer/public API | <0.5% | <30 minutes |
| Financial/payment API | <0.01% | <5 minutes |
Alerting thresholds:
| Condition | Severity | Action |
|---|---|---|
| Incident lasts >5 minutes | Warning | Investigate |
| Incident lasts >15 minutes (critical API) | Critical | Page on-call, escalate |
| Incident lasts >1 hour | Emergency | Escalate to management, public incident |
Real-world failure prevented:
A CI/CD API had a database migration that took 45 minutes. During that time, error rate was 100%. The team had no TTR metric. They thought "migrations just take time." But customers were furious. After tracking TTR, they realized 45 minutes was unacceptable. They redesigned the migration to be zero-downtime (shadow writes, backfill, then swap). TTR dropped to 0 minutes.
Metric #7: Throughput vs Concurrency (Connection Pooling Health)
What it is:
Throughput measures requests completed per second. Concurrency measures how many requests are "in flight" simultaneously. The relationship between them reveals your bottlenecks.
The law (Little's Law for APIs):
Concurrency = Throughput × Latency
If throughput is 100 RPS and average latency is 0.5 seconds, average concurrency is 50.
Why this matters:
| What you see | What it means | Action |
|---|---|---|
| Concurrency grows but throughput stays flat | You have a bottleneck (database, connection pool, single-threaded component) | Find the bottleneck and parallelize |
| Concurrency grows and throughput grows linearly | Healthy system | Keep scaling |
| Concurrency grows, throughput drops | System is overloaded; requests are timing out | Add capacity or rate limit |
Watch your connection pools:
| Resource | What to monitor | Alert if |
|---|---|---|
| Database connection pool | Active connections, waiting queries | Active >80% of max |
| HTTP client pool (for external APIs) | Idle vs active connections | Active >90% of max |
| Thread pool (if using sync framework) | Queue size, active threads | Queue >100 |
2026 benchmarks:
| API type | Healthy throughput per instance | Concurrency at 50% load |
|---|---|---|
| Simple CRUD (Node.js async) | 5,000-10,000 RPS | 100-500 |
| CPU-heavy (Node.js, Python) | 500-2,000 RPS | 50-200 |
| Database-heavy (with pooling) | 1,000-3,000 RPS | 50-150 |
| ML/AI inference (GPU) | 10-100 RPS | 10-50 |
Alerting thresholds:
| Condition | Severity | Action |
|---|---|---|
| Connection pool >80% for 2 minutes | Warning | Increase pool size or add instances |
| Connection pool = 100% for 1 minute | Critical | Requests are waiting; immediate action needed |
| Throughput drops while concurrency rises | Emergency | Capacity exhausted; rate limit or scale now |
Real-world failure prevented:
A REST API had 50 database connections. Throughput was 500 RPS. Latency was 100ms. Little's Law says: Concurrency = 500 × 0.1 = 50 requests. That meant every database connection was used. No headroom. A 10% traffic spike exhausted the pool. Alerting at 80% (40 connections) would have warned them to increase the pool to 100 connections before the spike.
Metric #8: Idempotency Success Rate (For Write Endpoints)
What it is:
For endpoints that accept an Idempotency-Key header, this metric tracks how often:
- Duplicate requests with the same key are correctly rejected (return 409 or 200 with cached response)
- Duplicate requests accidentally create duplicate side effects
Why this matters:
Non-idempotent APIs are a silent data corruption risk. A user clicks "pay" twice. Network retries. A mobile app re-sends a request. Without idempotency, you get duplicate charges, duplicate records, and angry customers.
How to calculate it:
Idempotency Success Rate = (Requests correctly handled ÷ Total requests with idempotency key) × 100
What to watch for:
| Signal | What it means | Action |
|---|---|---|
| >1% of duplicate keys are not rejected | Your idempotency store is failing or expired | Increase TTL or move to persistent store |
| Duplicate key responses vary (sometimes 200, sometimes 409) | Inconsistent idempotency logic | Fix implementation |
| Clients never send idempotency keys | Poor SDK documentation or adoption | Add to your SDKs and error messages |
2026 benchmarks:
| API type | Target idempotency success rate |
|---|---|
| Payment/transaction API | 99.99% (1 in 10,000 failures) |
| Write API (non-financial) | 99.9% |
| Internal API | 99% |
Alerting thresholds:
| Condition | Severity | Action |
|---|---|---|
| >0.1% duplicate keys not rejected in 5 minutes | Critical | Page on-call; potential data duplication |
| Idempotency store latency >50ms | Warning | Check Redis/database performance |
Real-world failure prevented:
A subscription API's idempotency store was Redis with a 24-hour TTL. A customer tried to upgrade their plan, hit a network error, retried after 25 hours. The second request was treated as new. They were charged twice. The fix: persistent idempotency store (database) with 30-day TTL, plus an alert if TTL expired before the typical retry window.
Metric #9: API Freshness / Cache Hit Ratio
What it is:
For endpoints that serve cacheable data (CDN, API gateway cache, database query cache), track how often a request is served from cache versus hitting the origin.
How to calculate it:
Cache Hit Ratio = (Cache hits ÷ Total requests) × 100
Why it matters:
Every cache miss is work your origin server must do. Every cache hit is a request that cost nearly nothing.
What to watch for:
| Signal | What it means | Action |
|---|---|---|
| Cache hit ratio dropping | Data changing more frequently OR cache TTL too short OR cache layer failing | Investigate origin traffic spike |
| Cache hit ratio <50% for public endpoints | You are doing too much work | Increase TTLs or cache more aggressively |
| Cache hit ratio >90% for user-specific data | User-specific data is being cached incorrectly | Dangerous – you may be serving wrong data |
2026 benchmarks (by endpoint type):
| Endpoint type | Good cache hit ratio | Excellent |
|---|---|---|
| Public, rarely changing (e.g., /countries) | >99% | >99.9% |
| Public, moderately changing (e.g., /pricing) | >80% | >95% |
| User-specific (authenticated) | 0% (should not be cached) | N/A |
| Product catalog (e-commerce) | >70% | >90% |
| Real-time data (stock prices, sports scores) | <5% (acceptable – real-time is hard to cache) | 10-20% with short TTLs |
Alerting thresholds:
| Condition | Severity | Action |
|---|---|---|
| Cache hit ratio drops >20% in 1 hour | Warning | Check for deployment that changed headers |
| Cache hit ratio <30% for 1 hour (cacheable endpoint) | Critical | Origin is overloaded; investigate |
| Cache hit ratio >50% for authenticated endpoint | Critical | Security risk – fix cache headers immediately |
Real-world failure prevented:
A social media API had a feed endpoint. Cache hit ratio was 85% – great. Then it dropped to 20% overnight. The cause? A deployment removed the Cache-Control header. Every request hit the database. Database CPU went from 20% to 80%. The API slowed from 150ms to 900ms. The cache hit ratio alert caught it within 15 minutes. The header was restored. Crisis averted.
How to Collect These Metrics (Without Building Your Own)
| Tool | What it tracks | Cost | Best for |
|---|---|---|---|
| Datadog APM | Latency, error rate, dependency health, traces | Paid (starts ~$15/host/month) | Enterprise, full-stack visibility |
| New Relic APM | Same as Datadog | Paid (~$10-50/host/month) | Enterprise, good for large teams |
| Prometheus + Grafana | Everything (self-hosted) | Free (hosting costs) | Teams with ops expertise |
| Honeycomb | High-cardinality events, deep debugging | Paid (usage-based) | Debugging complex failures |
| Sentry (for APIs) | Error tracking, latency by endpoint | Free tier, paid above 5k errors/month | Small teams, error-focused |
| CloudWatch (AWS) | Built-in for API Gateway, Lambda, etc. | Pay per metric | AWS-only stacks |
| PostHog | Product analytics + API monitoring | Free tier | Product-focused APIs |
| Updown / Better Stack | Uptime + latency monitoring | Free tier, paid ~$10-50/month | Simple monitoring, not deep APM |
The bootstrapper stack (free/cheap):
- Prometheus + Grafana (self-hosted on a $10 VPS)
- Sentry for error tracking
- Better Stack for uptime alerts
Your 30-Day Implementation Plan
| Week | Focus | Specific actions |
|---|---|---|
| 1 | Latency + Errors | Add p50/p90/p95/p99 tracking. Set error rate alerts. |
| 2 | RPS + Capacity | Establish baseline RPS. Run load tests to find capacity. Alert at 70%. |
| 3 | Dependencies + TTFB | Add dependency latency tracking. Set TTFB alerts. |
| 4 | Connection pools + Idempotency | Monitor connection pool usage. Audit idempotency for write endpoints. |
| Ongoing | Cache + Freshness | Set up cache hit ratio dashboard. Review weekly. |
The Bottom Line
Your API will fail. That is not the question.
The question is whether you will know about the failure before your customers do.
The nine metrics above are not optional. They are not "nice to have." They are the difference between a 2 AM page that becomes a 15-minute fix and a 10 AM customer complaint that becomes a 4-hour firefight.
Track latency by percentile. Track error rate by type. Know your capacity before you hit it. Measure your dependencies. Monitor your connection pools. Enforce idempotency. Watch your cache.
Do this before you need to. Not after.
Because the first time you realise you are not tracking something is always during an incident.
And incidents are a terrible time to add monitoring.
– Fredsazy

Iria Fredrick Victor
Iria Fredrick Victor(aka Fredsazy) is a software developer, DevOps engineer, and entrepreneur. He writes about technology and business—drawing from his experience building systems, managing infrastructure, and shipping products. His work is guided by one question: "What actually works?" Instead of recycling news, Fredsazy tests tools, analyzes research, runs experiments, and shares the results—including the failures. His readers get actionable frameworks backed by real engineering experience, not theory.
Share this article:
Related posts
More from Software
May 27, 2026
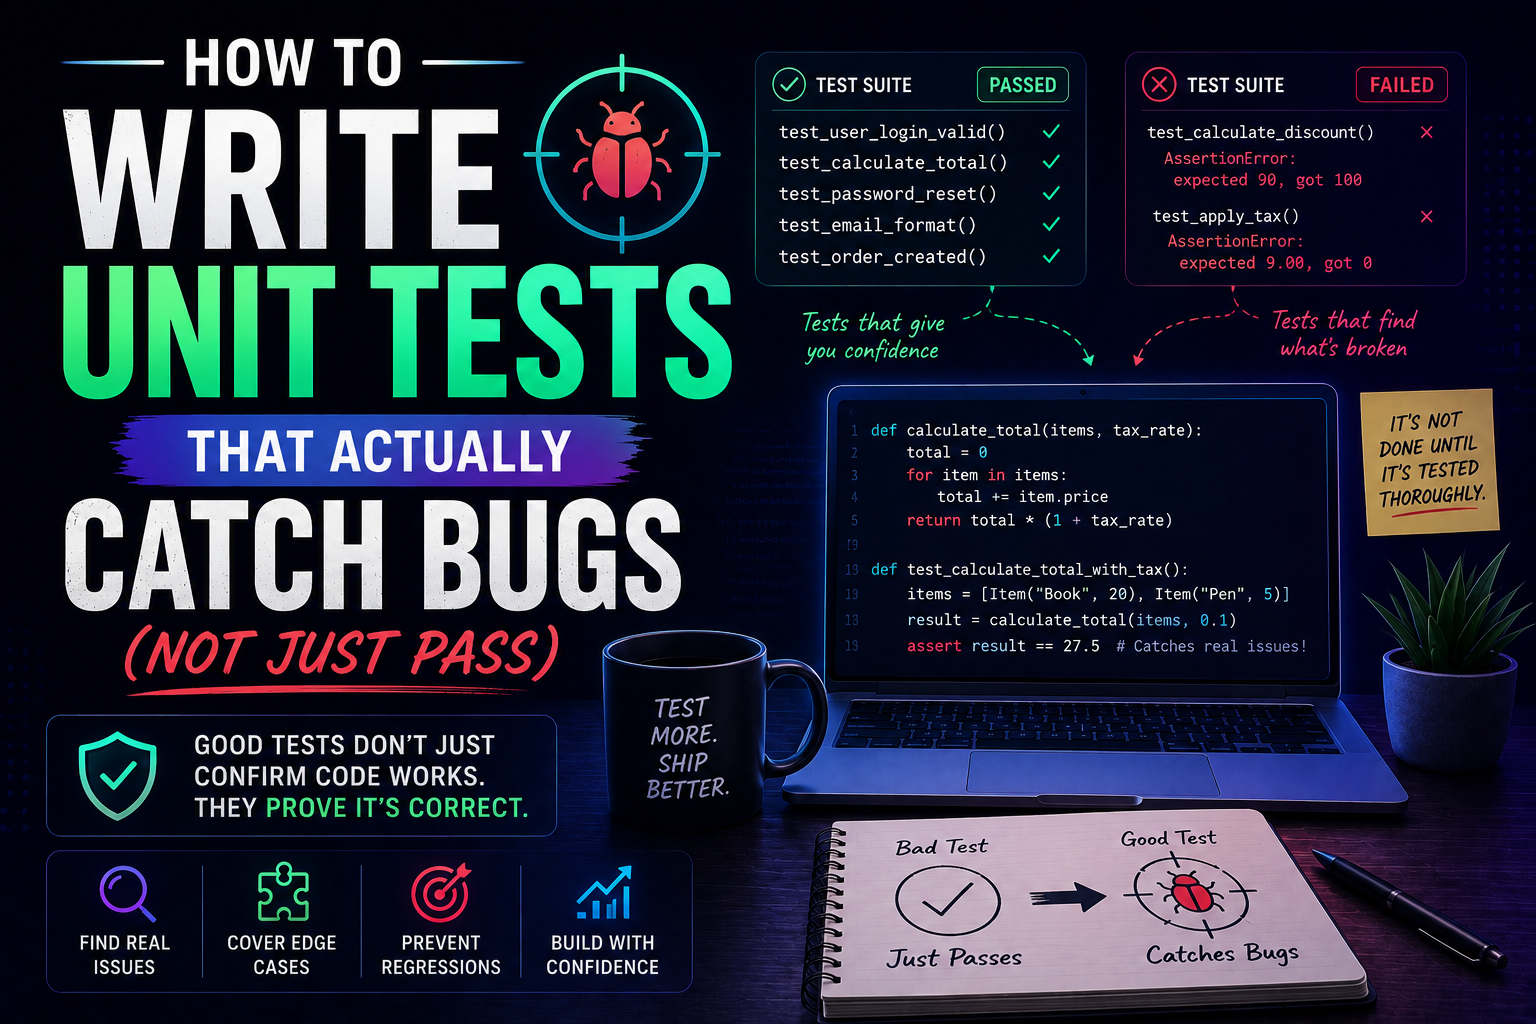
99Learn how to write unit tests that actually catch bugs — not just pass. Covers the AAA pattern, behaviour vs implementation testing, edge cases, test doubles, mutation testing, and a pre-commit checklist for writing tests that protect production.
May 13, 2026
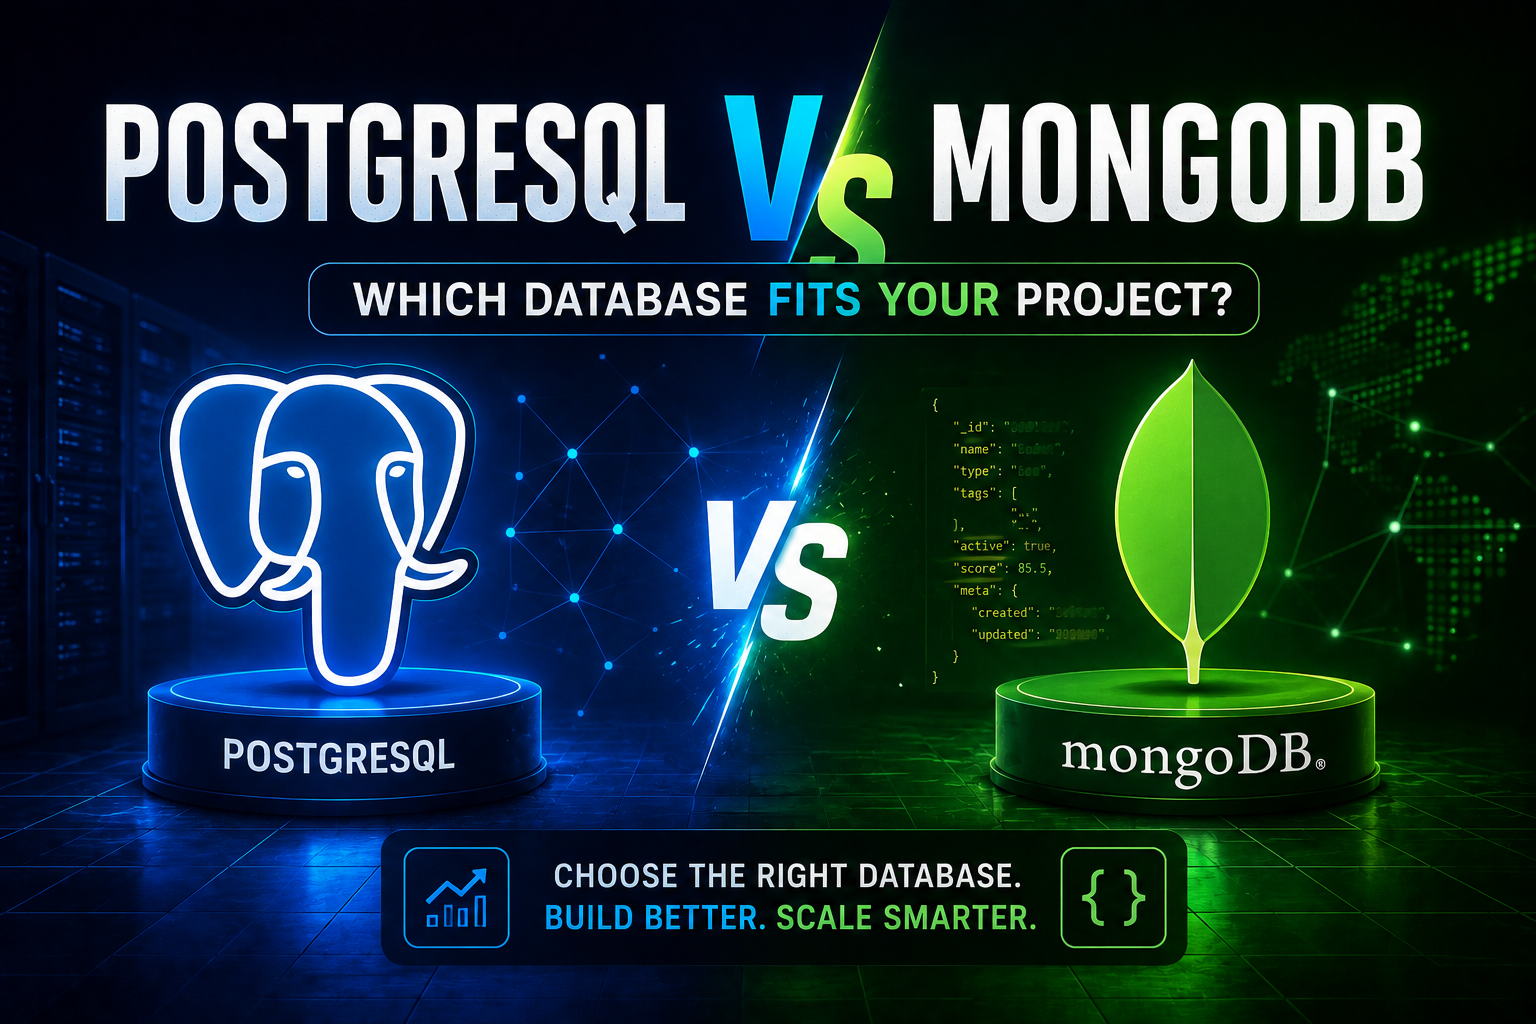
184PostgreSQL vs MongoDB in 2026 — an honest comparison covering benchmarks, data modelling, ACID transactions, scaling, pgvector vs Atlas Vector Search, pricing, and a decision framework for your project.
May 13, 2026
129SQL injection, no rate limiting, mass assignment – 7 security holes I still see in production APIs. Each takes under an hour to fix. Fix them before launch, not after the breach. Real code examples. Real checklist.